Sector / Electricity Distribution

Manage outages, losses and investment across a changing network

UMARP brings service continuity, meter data, field operations, asset condition, investment delivery and EPDK compliance into one electricity distribution platform.

Electricity distributors manage real-time events, service quality obligations, technical and commercial losses, customer response times and capital investment decisions simultaneously.
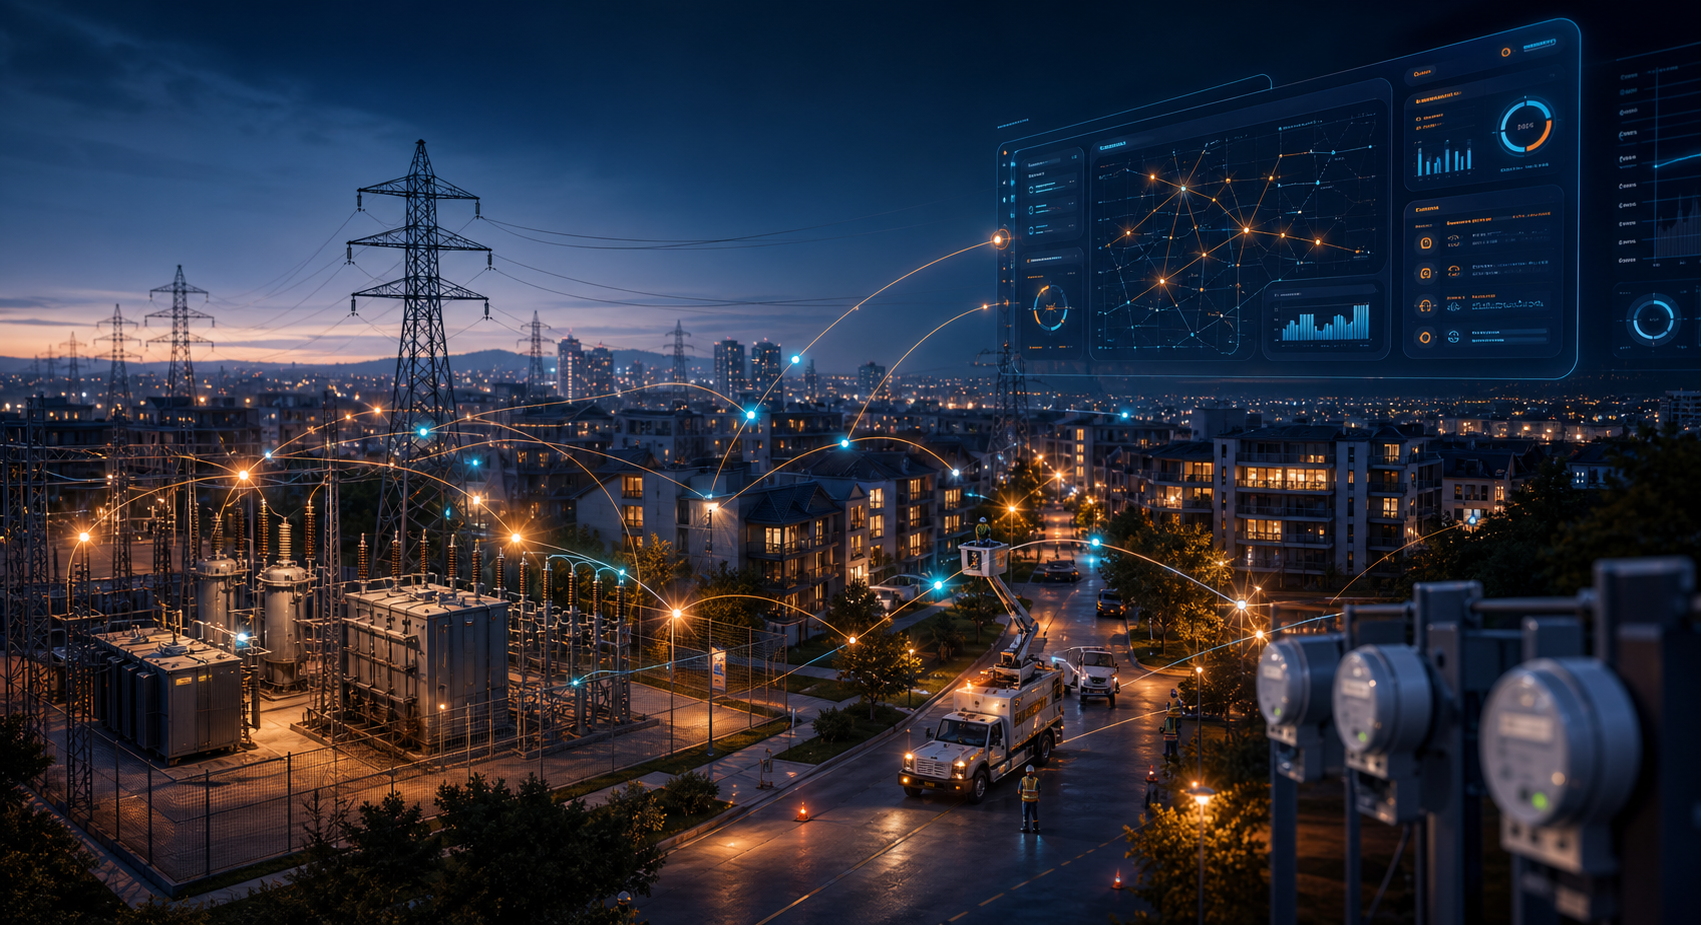
Illustration of a distribution network, substation, field crew and operations dashboard
Service continuityTrack outages, response, crews, assets and customer impact in one event record
Performance evidenceDaily operations feed EPDK quality, loss, investment and tariff reporting
The Electricity Distribution Challenge

Act on events as they happen

Illustration of operational visibility and early warning
Bring outages, meter readings, assets, crews and financial data into a current management view.

Loads change, faults occur, crews are dispatched, readings arrive and investment plans evolve. Every activity affects service quality and regulatory performance.

UMARP connects each fault report with the asset, location, outage area, affected customers, crew, materials, timing, costs and compliance indicators involved.

Management insightA prolonged outage affects customer satisfaction, service quality, field costs, loss exposure and regulatory performance together.
Electricity Distribution Priorities

Six priorities that shape daily operations

01Continuity

Capture outage performance at the time of the event

Keep planned and unplanned outages, fault types, affected customers, dispatch, response times and restoration records together.

02Energy Losses

Manage energy balances with reliable data

Assess readings, consumption anomalies, transformer service areas, customer profiles and inspection findings together to understand losses.

03EPDK Compliance

Support service quality with evidence

Link outage durations, connections, complaint resolution, call center activity and investment delivery to operational records.

04OPEX Control

Make repeat-visit costs visible

Track crews, vehicles, routes, materials, shifts and repeat work at work order level to reveal inefficiency before it reaches period-end accounts.

05CAPEX Priorities

Use asset condition to guide investment

Assess transformers, feeders, poles, cables, panels and meters by age, fault history, loading, regional risk and customer impact.

06Customer Service

Outage handling shapes customer trust

Connect applications, connections, fault reports, outage notifications, disputes and payments in one customer history.

Management Dashboard

Key indicators for electricity distribution managers

ContinuitySAIDI / SAIFI trendsTrack planned and unplanned outage duration and frequency by region, feeder and customer impact.
EventsEnd-to-end response timeVisibility from report intake and dispatch through arrival, repair, restoration and closeout.
LossesTransformer-area energy balanceSupply and consumption measurements, anomalies, suspected unauthorized use and technical loss concentrations.
MeterReading and data completenessMissing readings, remote data feeds, billing exceptions and MDM validation alerts.
AssetHigh-risk feeders and transformersPrioritize assets using fault history, loading, age, environmental risks and critical-customer impacts.
FinanceOPEX / faultField costs by fault type, crew, material, repeat visit and region.
InvestmentCAPEX deliveryPlanned versus delivered investments, site evidence, quantities, progress payments and budget variance.
ComplianceService quality risksService standards, calls, complaints, connection times and corrective action completion.
Outage and Continuity Management

Manage the full impact of an outage

Effective continuity management connects the origin of an event, affected assets and customers, crew response, restoration timing and service quality impacts.

Planned outages, unexpected faults, weather events, feeder trips, transformer issues and customer-side incidents need different responses. UMARP links event classifications to fieldwork, GIS locations, affected customers, asset histories and financial impacts.

AA Complete Event Record

One history from report to field response

Bring call center reports, SCADA/OMS signals, field observations, customer notifications and completion evidence into one incident history.

BAffected Areas

Measure customer impact

Show outage footprints, affected customers, critical facilities, duration and recurring incidents in the management view.

Tariff and Revenue Management

Manage tariff inputs throughout the year

Traditional Approach

  • Investment delivery, maintenance costs and service quality data are collected from separate sources at period end.
  • Outage performance, customer processes and financial records require manual reconciliation.
  • Loss and measurement-quality variances reach tariff submissions late.
  • Tracing a reported figure to its operational source takes time.

The result: late detection, weak supporting evidence and a heavy reporting workload.

UMARP in practice

  • Monitor OPEX, CAPEX, outages, losses, meter data and service quality throughout the period.
  • Tariff inputs accumulate as part of daily operations.
  • Trace financial figures to work orders, assets, meters, customers or accounting records.
  • Focus reconciliation on verifying sources rather than rebuilding data.

The result: early warnings, current forecasts and audit-ready tariff records.

Field Operations, Assets and Energy Losses

Connect loss analysis to fieldwork and investment

Electricity loss management goes beyond inspection teams. Transformer-area energy balances, reading quality, consumption anomalies, technical losses, asset condition and field findings need to be assessed together.

MeasurementTransformer and meter readings, validated by MDM
AnomalyConsumption anomalies, regional risks and suspected unauthorized use
FieldworkInspection orders, crews, routes and evidence
CorrectionBilling adjustments, disputes and customer notifications
InvestmentAsset risks, technical losses and capital investment priorities
01Transformer Service Areas

Assess energy balances locally

Monitor supply measurements, customer consumption, loss rates and inspection history together.

02Meter Data

Resolve data gaps before billing

Manage reading exceptions, communication failures, inconsistent readings and pre-billing validation.

03Field Evidence

Support inspection findings with clear evidence

Keep photos, locations, timestamps, seal details, meter condition and inspection reports in one case file.

04Asset Condition

Use fault histories to guide investment

Prioritize feeders, transformers, panels, cables and poles using failure frequency and loading.

05Materials and Inventory

Link every material issue to a work order

Assign breakers, meters, cables, panels and consumables to the relevant cost center and asset.

06Progress Payments

Verify investment delivery on site

Build a complete project record with quantities, installation details, photos, acceptance and payment information.

Financial Visibility

Keep costs, investments and quality in view

Effective financial management connects field costs, capital delivery, energy losses and service quality in the same operational picture.

QualityContinuity and service standards
OPEXFieldwork, crews, routes and repeat jobs
CAPEXNetworks, assets and investments
Financial oversightCurrent budgets and traceable tariff inputs
01Fault Response Costs

Know the cost of each incident

Track crews, vehicles, materials, time and repeat visits at incident level.

02Financial Impact of Losses

Understand the cost of lost energy

Analyze technical and commercial loss indicators by area, meter and customer.

03Investment

Verify CAPEX with field records

Connect projects, quantities, progress payments, materials and acceptance records to finance.

04Budget

Identify variances early

Compare planned, actual and forecast costs throughout the period.

05Collection

Connect cash flow with customer activity

Monitor charges, disputes, payments, delays and service disconnections or reconnections together.

06Tariff Impact

Bring quality and cost into tariff preparation

Use service quality, losses, investment and OPEX records as tariff inputs.

Customers, Meters and Service Quality

Measure every step of the customer experience

01Connection Applications

Connect applications, surveys and service connections

Link requests, site surveys, designs, deposits, contracts and energization records to the customer history.

02Meter Operations

Reliable readings support reliable revenue

Manage reading plans, validation, remote readings, missing data and meter replacements in one workflow.

03Outage Information

Keep customers informed at the right time

Planned outage notices, estimated restoration times and actual status use the same event record.

04Disputes and Complaints

Respond with evidence

Link invoices, readings, outages, connections and inspection evidence in the customer case file.

05Disconnection and Reconnection

Connect arrears management with fieldwork

Payment status, field orders, completion evidence and reconnection requests share the same customer history.

06Omnichannel Service

Maintain one complete customer view

Combine call center, portal, app, field notifications and internal notes in a shared history.

EPDK Compliance and Reporting

Measure service quality as work happens

Electricity distributors report on continuity, connection times, customer service, losses, investments and quality. UMARP generates these indicators from operational activity instead of compiling separate files at period end.

01Event recordsOutages, faults, connections, meters and complaints
02Supporting evidenceLocations, timestamps, crews, photos and measurements
03Performance indicatorsSAIDI, SAIFI, losses, service times and investments
04Reconciliation fileSource-linked EPDK and tariff data
01Supply Continuity

Generate outage metrics from event records

Calculate duration, frequency, affected customers, planned or unplanned status and closeout reasons from recorded events.

02Connection Times

Track each application stage

Timestamp surveys, designs, contracts, installation and energization.

03Loss Targets

Connect readings and inspection results to reporting

View transformer-area balances, unauthorized-use inspections, meter validation and billing corrections together.

04Investment Delivery

Link every project to verified site work

Keep GIS boundaries, quantities, materials, progress payments, photos and acceptance records in one project file.

05Corrective Actions

Assign and track follow-up actions

Record an owner, deadline, impact, evidence and closeout status for each deviation.

06Audit Trail

Trace every figure to its source

Link every reported value to a work order, customer, meter, asset or financial record.

Smart Grid Readiness

Make room for distributed energy, smart meters and sensors

Smart meters and MDMConnect remote readings, missing-data handling, profile analysis, billing exceptions and consumption anomalies with CIS and field workflows.
Network sensorsLink transformer, feeder, load, voltage and event signals to asset condition and outage management.
Early warningsHighlight anomalies, overloads, recurring faults, regional losses and field capacity on management dashboards.
Platform Approach

One consistent view of network events

Customer systems, OMS/SCADA, GIS, field applications, MDM, finance and reporting often hold disconnected views. UMARP brings them together for operational oversight.

Shared data platformConnect readings, outages, maps, progress payments, work orders and tariff submissions through consistent records.
Open integrationSCADA/OMS, MDM, GIS, CIS, ERP and field systems become connected parts of traceable workflows.
Modular expansionStart with outages, losses, meters, fieldwork or compliance and expand without fragmenting the platform.
Smart grid readinessDistributed energy, sensors, smart meters and growing data volumes extend the platform’s architecture.
UMARP connects continuity management, loss reduction, investment performance, EPDK compliance and financial control for electricity distributors.

Five priorities for electricity distribution

Electricity distributors must manage dynamic networks while meeting service quality requirements and maintaining financial sustainability. UMARP supports five connected priorities.

Priority 01ContinuityUse event records to manage outages and response, and to produce service quality indicators.
Priority 02Energy lossesConnect readings, anomalies, inspections, billing corrections and collections through to resolution.
Priority 03OPEXTrack field costs by crew, route, material, time and repeat work.
Priority 04CAPEXBase investments on asset condition, fault history, loading and customer impact.
Priority 05EPDK complianceBuild quality, investment, loss and tariff records every day.

Effective network management connects accurate event data to its financial and regulatory impact.

Traceability

From outage report to tariff reconciliation

ReportDetectionCrewRepairMeterChargesReconciliation
OutcomesVisibility into continuity, loss investigations, investment delivery and tariff inputs.
Audit trailLinked events, meters, customers, assets, field evidence, progress payments, financial records and compliance metrics.
Management valueSee how operational decisions affect continuity, revenue, costs, customers and regulatory performance.
Next Step

Let’s map your electricity distribution operations

We can review how outages, losses, meters, fieldwork, assets, tariffs and compliance interact across your organization.

  • Assess SAIDI/SAIFI, response times and service quality
  • Review losses, meter data, MDM and inspection workflows
  • Plan CAPEX, progress payments, OPEX, tariffs and EPDK reporting