Sector / Natural Gas Distribution

Run a safety-critical network within a regulated revenue framework

UMARP connects revenue assurance, field safety, investment performance, service quality and EPDK compliance across natural gas distribution.

Gas distribution links licensing, tariffs, safety, customer service and investment obligations. Meter readings, billing, leak response, valve isolation, construction progress and SKB reconciliation all have financial and regulatory consequences.
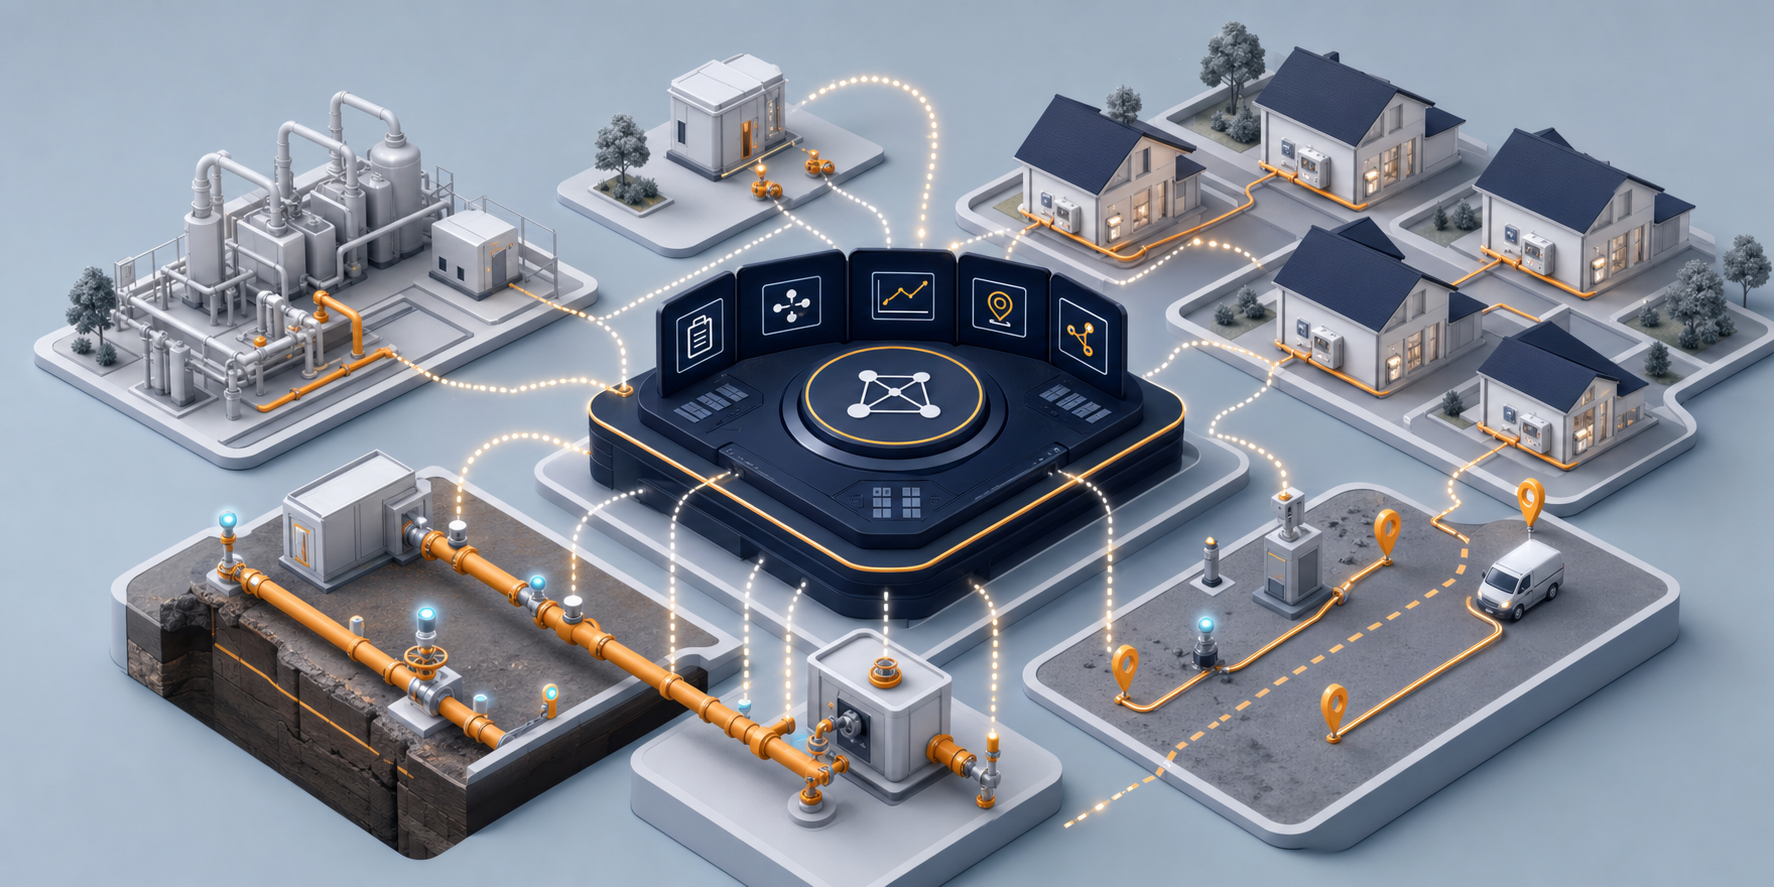
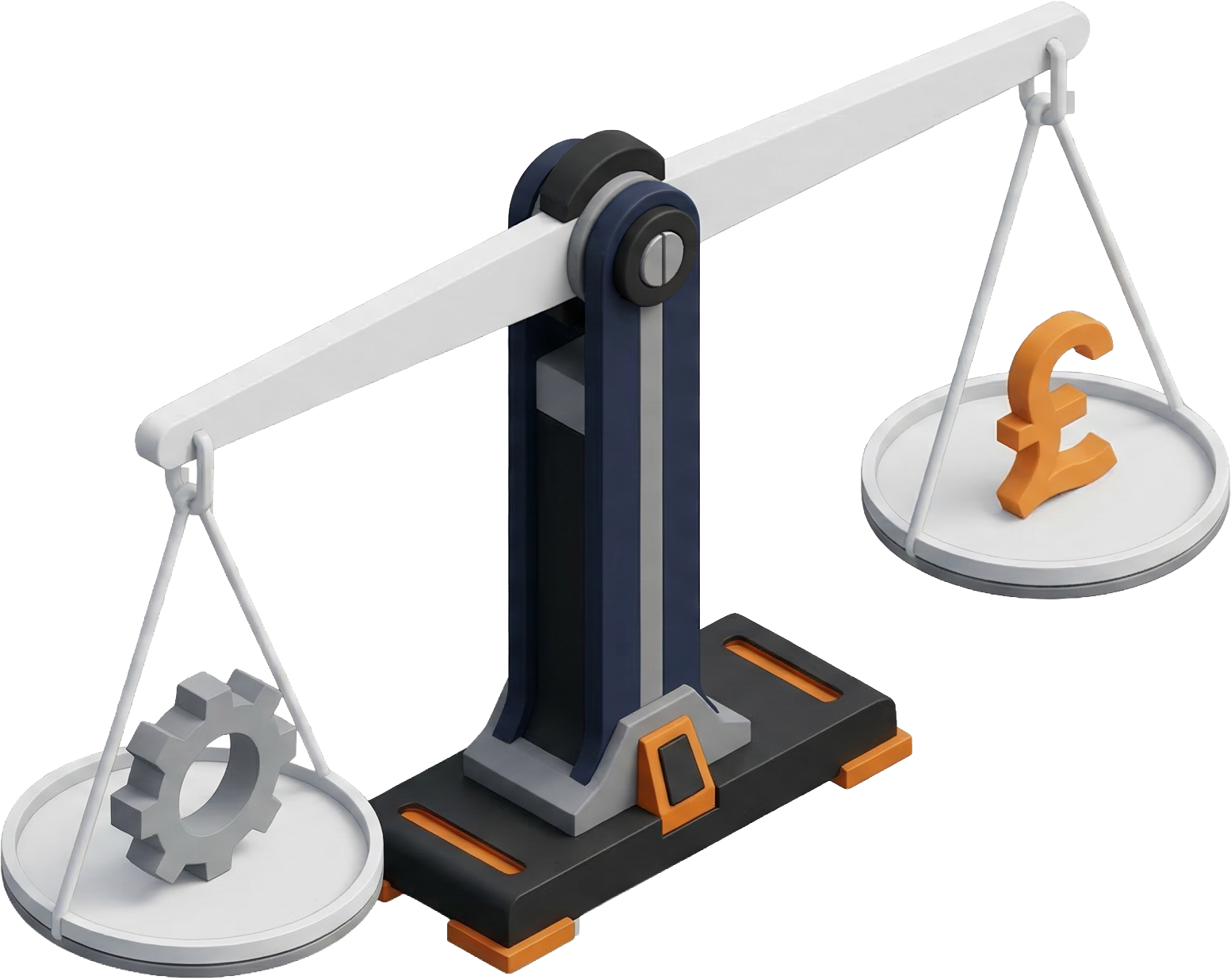
Illustration connecting gas distribution infrastructure, field operations and a central management platform
Revenue assuranceConnect reading, billing, collections, losses and SKB reporting
Safety evidenceCapture leak response, valve operations, pressure tests and crew closeout records in the field
The Operating Challenge

See the financial and regulatory impact of operational events

Illustration of aligned operational and financial records
A field record should connect directly to finance, tariffs and audit evidence.

Gas distributors operate within a regulated revenue framework while managing real-world field costs. Efficiency, loss reduction, safety and service quality are therefore central to operating performance.

UMARP connects each operational event across the business. A service connection, leak report, regulator fault, meter replacement or construction job links to the customer, asset, location, work order, materials, payments, costs and compliance records involved.

Management insightLate detection of risk puts revenue, safety, service quality and license compliance under pressure at the same time.
Gas Distribution Priorities

Six management priorities, one connected operating model

01Revenue Assurance

Performance within the regulated revenue framework

Regulated revenue makes reading quality, accurate billing, effective collections, loss detection and correct tariff application essential to financial performance.

02Operational Risk

Safety-critical fieldwork

Leak response, pipeline isolation, pressure testing, service connections and periodic inspections require precise execution and reliable evidence.

03Regulatory Obligations

EPDK performance requirements

Investment delivery, loss targets, connection times, response times and service quality indicators affect both revenue and license compliance.

04OPEX Control

Know the cost of fieldwork

Track crew, vehicle, routing, material, repeat-visit and unplanned-response costs at work order level to identify budget variances before period end.

05CAPEX Performance

Base investment decisions on asset evidence

Assess pipelines, valves, connections and regulator stations by age, fault history, location, materials and service impact.

06Customer Service

Every interaction shapes the customer experience

Connection applications, meter installation, billing disputes, arrears, disconnections, reconnections and emergency reports all contribute to one customer relationship.

Management Dashboard

Key indicators for gas distribution managers

RevenueMeter reading accuracyReading validation, exception rates, repeat readings and corrections before billing.
CollectionCash-flow riskOverdue balances, collection speed, disconnection and reconnection impacts, and collection forecasts.
LossesConcentrations of suspected lossesLoss and unauthorized-use risks by region, meter type, customer group and consumption anomaly.
FieldworkResponse timeSLAs, routing and crew performance for leaks, faults, connections and maintenance.
AssetHigh-risk network assetsAsset groups with elevated risks from age, fault history, material type and network criticality.
FinanceOPEX / kmOperating costs and repeat-work impacts by pipeline, region, crew and job type.
InvestmentCAPEX deliveryPlanned versus completed investments, measured quantities, progress payments, site evidence and budget variance.
ComplianceCorrective action completionAudit findings, owners, deadlines, evidence and completion status in one management view.
Revenue and Tariff Management

Identify revenue leakage at its source

UMARP manages the full revenue cycle, from reading quality and charge accuracy to collections and cash-flow planning.

Gas distribution revenue depends on distribution charges, gas-cost pass-through, tariff rules and collection performance working together. A reading error can lead to incorrect billing, a dispute, a late payment and cash-flow pressure.

ASources of Revenue Leakage

Monitor the whole chain

Track missed readings, weak validation, unauthorized use, incorrect tariff dates, late collections and misclassified customers together.

BIn-Period Forecasting

Prepare for tariffs throughout the year

Use daily operational records to forecast OPEX, CAPEX, service quality, losses and investment delivery throughout the period.

Tariff Period

Continuous oversight across the tariff period

Traditional Approach

  • After period end, data is gathered separately from customer, field, GIS and finance systems.
  • Variances emerge during reporting, often too late for corrective action.
  • Tariff preparation becomes a separate, intensive data collection exercise.
  • OPEX, CAPEX, service quality and loss indicators require manual reconciliation.
  • Tracing figures used in EPDK reconciliation back to their source takes time.

The result: late visibility, weak supporting evidence and additional reporting effort.

UMARP in practice

  • Monitor SKB inputs, OPEX, CAPEX, service quality, reading accuracy and field productivity throughout the period.
  • Tariff inputs accumulate from daily operations instead of being reconstructed at period end.
  • Use a shared dataset for annual and five-year tariff preparation scenarios.
  • Trace financial figures to work orders, assets, meters, progress payments or accounting records.
  • Bring source-linked data and documented assumptions to reconciliation and review.

The result: early warnings, current forecasts and audit-ready tariff records.

UMARP supports compliance as work happens. Each work order, material movement, fault report and financial entry contributes to the evidence behind regulatory and tariff reporting.

Unauthorized Consumption and Metering Quality

Connect investigation, evidence and billing

Assess consumption anomalies, meter types, reading histories, regional patterns, customer behavior, previous reports and inspection results together. UMARP narrows discrepancies by area and customer, then turns suspicious records into targeted work orders.

AnomalyConsumption changes, meter type and reading history
InspectionRisk score, route, crew and inspection order
EvidenceInspection report, photos, location and seal details
ChargesCorrections, additional charges and dispute records
CollectionCash impact, follow-up and closeout report
01Anomaly Detection

Understand consumption in context

Analyze region, customer group, meter type, seasonality, past consumption and neighboring-area patterns together.

02Targeted Inspections

Prioritize high-risk records

Send high-risk customers and measurement points to field teams as priority inspections instead of relying on general checklists.

03Verified Closeout

Keep the report and evidence together

Close inspections with photos, location, the inspection report, meter condition, seal details and crew signatures.

04Billing Impact

Link findings to the revenue cycle

Confirmed unauthorized use or measurement errors feed corrections, additional charges, disputes and collections from the same incident record.

05Regional Patterns

See risk on the map

Group suspected losses and metering-quality issues by neighborhood, pipeline, station or reading route.

06Preventive Action

Address recurring causes

Turn findings into meter replacements, revised reading plans, inspection schedules and customer follow-up.

Safety and Field Operations

Verify the work, not just its status

01Gas Leaks

Track emergency reports through to resolution

Keep report time, priority, dispatch, route, arrival, valve isolation, pressure checks and closeout in one incident record.

02Network Impact

Assess the impact before isolating a valve

Use GIS topology to identify affected pipelines, customers, critical facilities and alternative intervention points.

03Offline Fieldwork

Keep records when coverage is poor

Crews complete records offline. Photos, signatures, test results and locations synchronize when connectivity returns.

04Capability

Assign each job to a qualified team

Dispatch uses region, route, capacity, expertise, certification and risk priority.

05Materials

Connect material use to stock and costs

Field consumption updates stock balances, asset records and cost centers, supporting progress payments and budget checks.

06Closeout

Capture evidence as work happens

Photos, video, digital signatures, pressure-test results, timestamps and locations support verified completion.
Asset Management and Capital Investment

Prioritize CAPEX using the network’s risk profile

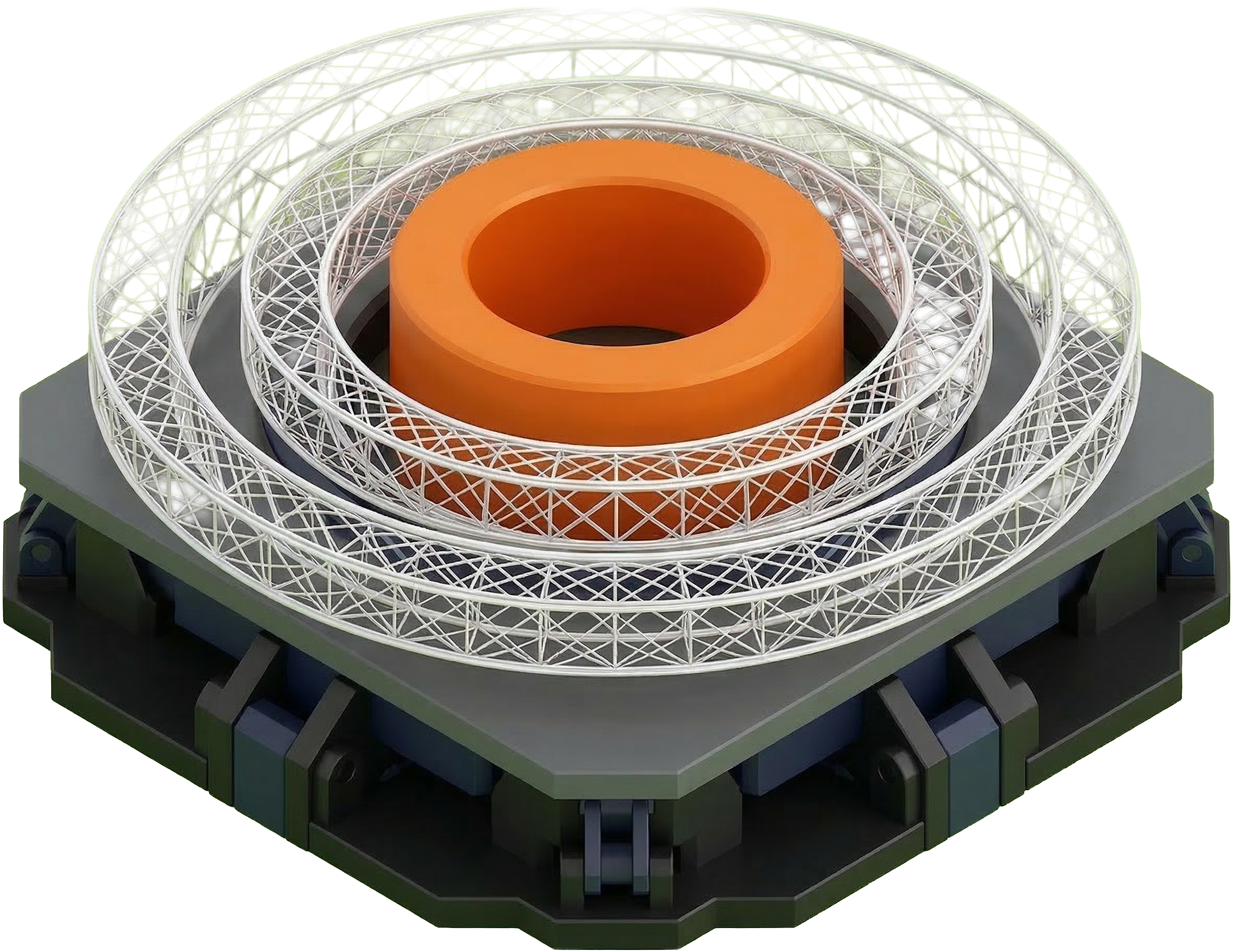
Asset relationships and digital twin model
A digital twin keeps network connectivity, asset relationships and risk information current.

Every pipeline, regulator station, connection, valve, pressure point and meter is a capital asset with a service life, maintenance history, failure profile and location-specific criticality.

UMARP links maintenance, faults, material use and completed fieldwork to asset records. Identify what you own, where risks are growing, whether budgets are well targeted and how performance changes after investment.

Investment insightWhen a regulator fails, see its connected lines, customers, critical facilities, maintenance history and investment implications together.
Financial Visibility

Keep OPEX, CAPEX and tariff inputs aligned

Daily operational data connects field spending, investment delivery and tariff impacts, giving management a current financial view.

SKBRegulated revenue and tariff impact
OPEXFieldwork, crews, routes and repeat jobs
CAPEXInvestments, quantities and progress payments
Financial oversightCurrent budgets and traceable reconciliation
01Field Expenditure

Know where the money went

Link field costs to work orders, assets, projects and cost centers.

02Inventory and Procurement

Record actual material use

Material consumption updates stock, projects and asset records while informing replenishment.

03Progress Payments

Reduce the risk of paying for uncompleted work

Progress payments require field evidence, measured quantities, photos and location records.

04Budget

Identify overruns early

Monitor planned, actual and forecast costs throughout the period.

05Cash Flow

Use collection patterns to improve forecasts

View actual, planned and expected cash flows together.

06Tariff Impact

Feed financial data into regulatory submissions

OPEX and CAPEX records provide traceable inputs for tariff preparation and reconciliation.

Customers, Meters and Service Quality

Connect every stage of the customer life cycle

01Connection Applications

One workflow for surveys, design and contracts

Link the application, site survey, connection design, deposit, contract and meter installation to one customer history.

02Meter Operations

Track installation, replacement and reading quality

Monitor meter age, reading validation, exceptions, replacement reasons and measurement anomalies together.

03Dispute Management

Respond with supporting evidence

Keep reading photos, reading histories, billing rules and inspection results in one case file.

04Disconnection and Reconnection

Connect arrears management with fieldwork

Payment status, disconnection orders, field completion and reconnection requests share a linked customer and work order history.

05Call Center

Give every channel the same customer view

Calls, portal activity, mobile requests, field notifications and faults appear in one customer history.

06Service Standards

Generate service metrics from operational records

Measure connection times, response times, complaint resolution and repeat-work rates.

EPDK Compliance and Reporting

Build regulatory evidence through daily operations

Licensed gas distributors report on investment delivery, losses, connection times, customer service and fault response. UMARP produces these indicators from work as it happens, rather than collecting them retrospectively.

01Operational recordsWork orders, readings, maintenance, faults and connections
02Supporting evidencePhotos, locations, signatures, quantities and test results
03Performance indicatorsService quality, losses, investments and response times
04Reconciliation fileSource-linked EPDK and tariff data
01Investment Delivery

Document every project

Track mapped boundaries, field evidence, measured quantities, materials, progress payments and accounting in one project file.

02Service Quality

Generate time-based metrics automatically

Connection, fault response, complaint resolution, disconnection and reconnection times come from operational records.

03Loss Targets

Connect measurements and findings to reporting

Reading quality, meter anomalies, confirmed losses and billing corrections produce traceable indicators.

04Audit Evidence

Trace every figure to its source

Link reported values to work orders, assets, meter data, financial transactions or field evidence.

05Corrective Actions

Turn findings into follow-up work

Assign deviations to an owner with a deadline, evidence, closeout status and impact assessment.

06Reconciliation Readiness

Prepare the file throughout the period

Current tariff, investment and quality data reduces the last-minute workload before review.

IoT, Sensors and Smart Meters

An architecture ready for new data sources

Pressure and sensor dataConnect pressure, flow, station and critical-point measurements to assets and events.
Smart metersHigher reading frequencies feed MDM and CIS through the existing data architecture.
Early warningsSurface anomalies, consumption changes, regional risks and crew performance on management dashboards.
Platform Approach

Shared data. Open architecture.

Gas distributors often operate separate customer, GIS, field, finance and reporting systems. Each connection adds cost and opportunities for delay or inconsistency. UMARP brings these activities into a coherent management view.

Shared data platformConnect meter readings to accounting, GIS to progress payments and work orders to tariff submissions through consistent records.
Open standardsRetain ownership of organizational data and the freedom to integrate systems and choose technologies.
Modular expansionStart with the highest-priority need and expand revenue assurance, fieldwork, assets or compliance without fragmenting the data.
IoT and smart meter readinessPressure, sensor, consumption and anomaly data extend the existing architecture.
UMARP brings revenue assurance, operational safety, EPDK compliance and financial control into a connected gas distribution platform.

Five priorities for gas distribution

Gas distributors must operate safety-critical networks at sustainable cost within regulated revenue and compliance requirements. UMARP supports five connected priorities using shared operational data.

Priority 01Revenue leakageIdentify and address issues in measurements, billing, disputes, collections and suspected unauthorized use at their source.
Priority 02Safety recordsDocument each response with location, time, crew, test results and completion evidence.
Priority 03OPEXTrack field costs by work order, crew, route, material and repeat visit.
Priority 04CAPEXBase investments on asset condition, fault history and network risk.
Priority 05EPDK complianceBuild service quality, investment and tariff evidence through daily operations.

UMARP provides the connected information gas distributors need to make informed operational decisions.

Traceability

From customer application to tariff reconciliation

ApplicationDesignMeterReadingChargesResponseReconciliation
OutcomesVisibility into revenue assurance, field safety evidence, investment delivery and tariff inputs.
Audit trailLinked applications, contracts, readings, work orders, site evidence, progress payments, financial records and compliance metrics.
Management valueSee how an operational decision affects revenue, cost, service quality and regulatory performance.
Next Step

Let’s map your gas distribution operations

We can review revenue, fieldwork, assets, tariffs, customer service and compliance as connected processes.

  • Assess SKB inputs, billing, collections and revenue leakage
  • Review leak response, maintenance, connections and field evidence
  • Plan CAPEX, progress payments, tariff preparation and EPDK reporting